
Where is brown on the color spectrum? It seems the rainbow left a color out. Why is that?
Light has a single variable, frequency. If you only looked at a single photon at a time then the only possible colors you could see would be the below. These are what we see for photons between 380 and 780 nanometers.

If this makes up all the possible colors of light, then where are the other colors such as brown?
Eyeballs have photoreceptors that produce electrical signals when photons hit them. That signal is sent to the brain and experienced as color. We have ~4.5 million cones (the photoreceptors responsible for color vision) per eye, and many more rods (photoreceptors for the low light environment), so we get an entire image of vision rather than just a single point. Humans have three types of cones which we call L (long wavelengths), M (medium wavelengths), and S (short wavelengths). Let’s look at how the M cone works.
One Cone
The stimulus-response distribution for an M cone for photons from 380nm to 780nm is seen below.

We see a strong response for green light and very little response for blue or red light. This means a small number of green photons looks identical to a large number of red photons, at least when just considering this cone type. The Bottlenose Dolphin has only a single cone type, so blue and red look the same to them. Having a single cone type means seeing the world in greyscale, color is represented as a single number.
But it’s not just photons of a single frequency that enter the retina, there can be many photons of many frequencies being seen at once. This combination of photons can be represented as a density function over the frequency spectrum, known as a spectral power distribution. We can calculate the stimulus-response by multiplying the spectral power distribution by the stimulus-response distribution, then integrating over the result (all this means is we are adding up all the stimulus responses by each individual photon).
Here we see different spectrum distributions (top graph), followed by the stimulus-response distribution of the M cone (middle), and the multiplication of the two, as well as the integral of that function represented by the size of the circle (bottom).
Just like how photons of different frequencies can produce the same stimulus (look the same), so too can different spectrum power distributions produce the same stimulus values. Any combinations of light that produce the same stimulus (look the same) are called metamers.
Is there a way to find all the metamers for a given stimulus-response and stimulus distribution? The space of spectral power distributions is infinite dimensional (each point along the x-axis is a variable), so it is not easy to explore. Although difficult to imagine, metamers are the sets of all spectral power distributions distance $d$ away from the stimulus-response distribution in function space with the integral inner product.
Two Cones
Let’s add a second cone type with a different stimulus-response distribution. Now our brain will receive two stimulus values it has to interpret as a color. Let’s color code the two stimulus distributions so we can easily keep track of them.
We notice that the “red” and “green” stimulus values often look the same, even for all the different spectral power distributions we try. A good question to ask is whether all possible combinations of stimulus values are possible? For example, does there exist a spectral power distribution that results in stimulus values of 1.0 for the “red” cone and 0.0 for the “green” cone? And similarly 0.0 for the “red” cone and 1.0 for the “green” cone? If so, we could use those two spectral power distributions as basis vectors to build all possible perceivable colors. Let’s see what I mean.
We find some frequencies that activate either exclusively the “red” cone or exclusively the “green” cone. Let’s call these frequencies $R$ and $G$.
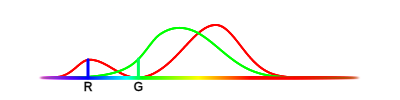
A photon at frequency $R$ would create the stimulus values $(1, 0)$, and at $G$ $(0, 1)$, where $a$ and $b$ represent the stimulus values of the “red” cone and “green” cone respectively.
Now we can build any stimulus value we want using only photons at frequencies $R$ and $G$. For example, if we want to send the stimulus value $(7, 2)$ to the brain of this two-coned being (a dog for example), then we send 7 photons at frequency $R$ and 2 photons at $G$ (assuming a single photon produces such a strong response, which we will for now). Since each photon only stimulates a single cone at a time, we can easily control the resulting values. This explains why brown is not on the color spectrum, it is a combination of different photons that produce a stimulus-response which an individual photon could not, no matter the frequency. If we instead picked photons at different frequencies, it would be harder to construct a specific color. Let’s see an example.

A photon at frequency $M$ would result in stimulus values $(2, 1.2)$, and at $N$ $(0.3, 1.7)$. What combination of photons do we use to produce $(7, 2)$ now? By solving the system of equations $m (2, 1.2) + n (0.3, 1.7) = (7, 2)$ for $m$ and $n$, we find our answer. Since this spectral distribution of $M$ and $N$ frequencies results in the same stimulus value as our previous combination of $R$ and $G$, then these two spectral distributions are metamers. But, if you actually solve this system, you find $n$ is negative. We can’t send a negative number of photons, which means it’s actually impossible for two basis frequencies $M$ and $N$ to be combined in any way such that you get the stimulus of $(7, 2)$.
The basis colors we choose can be one limiting factor, but so can the stimulus distributions. We can imagine a situation in which most colors can’t be created, such as when two stimulus distributions exactly overlap. In that case, no frequency could give us a stimulus value with one of the cones as zero and the other as non-zero. We need a tool to determine which stimulus values are possible given some stimulus distributions, and a new representation of the perceivable color space can help us with that.
We draw the curve traced out by sweeping through all possible frequencies and using the stimulus values as coordinates. For two cones, that will mean a 2D color phase space.
You might notice that our values $R$ and $G$ picked from before happen to lie exactly on the red and green axis, which makes sense since we picked those values such that they could act as basis vectors.
Let’s create two simple stimulus distributions in order to investigate the limitations of similar stimulus distributions. Watch what happens when we bring the two stimulus distributions closer together, and then shrink one of them.
When the distributions are far apart, the curve in phase space looks like two basis vectors. On the other extreme, when the two distributions overlap exactly, the possible stimulus values collapse into a single line, which is equivalent to going back to a single cone type. Interestingly, we see when the distributions almost completely overlap, the range or perceivable colors is severely limited (can’t ever produce a purely “green” stimulus). This tells us it’s possible to have two cone types and still be mostly color-blind. In order to have the full range of color experience, we need multiple cone types, each with its own distinct stimulus zone in the spectrum.
We capture enough information with the curve in phase space to account for all spectral power distributions, not just individual frequencies. Consider that spectral power distributions are functions over individual frequencies, and that the stimulus values are additive, so when we sum up (integrate) over the spectral power distribution, it must be made up of positive scaled vectors on that curve. So, if you simply draw the two straight lines from the origin that hug the curve on either side, you capture all possible stimulus values that can be generated by any spectral power distribution. This “cone” from the origin to all possible stimulus values is known as the spectral locus.
This begs the question, what is the range of colors perceivable by humans?
Three Cones
Let’s add the final cone that we humans use and look at the shape traced out in perceivable color space. These three stimulus distributions are from the standard XYZ Color Space.
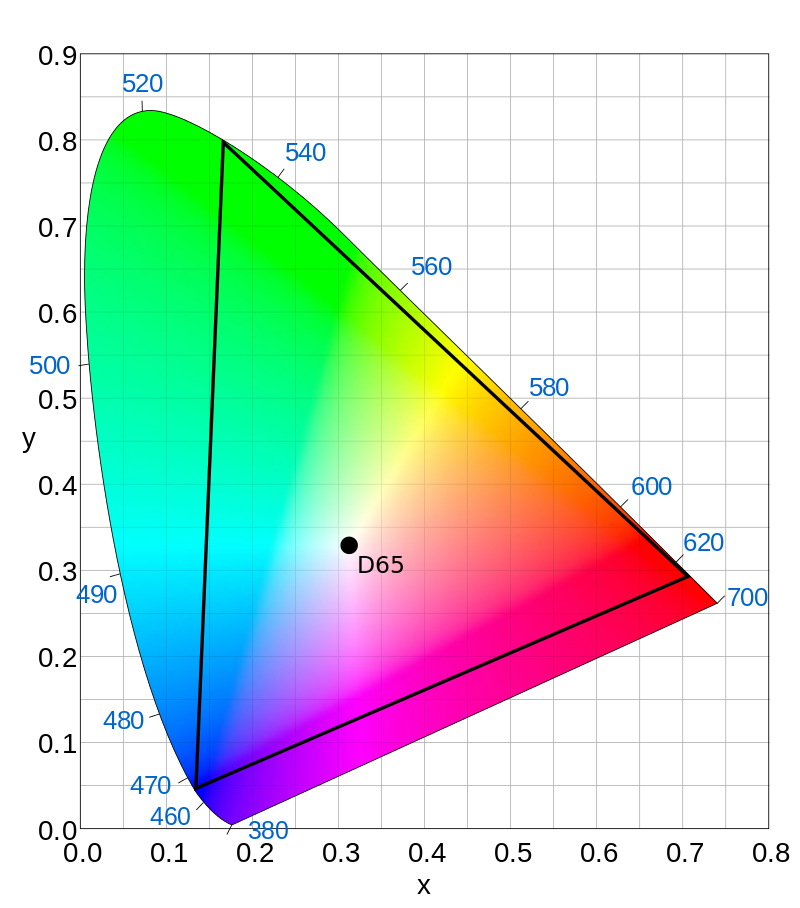
Also, take a look at this wonderful animation someone made. And if we take a slice of the locus made up from this 3D curve, we get the range of perceivable colors at a specific brightness (the shape is the same for all brightness values, simply scaled up or down).
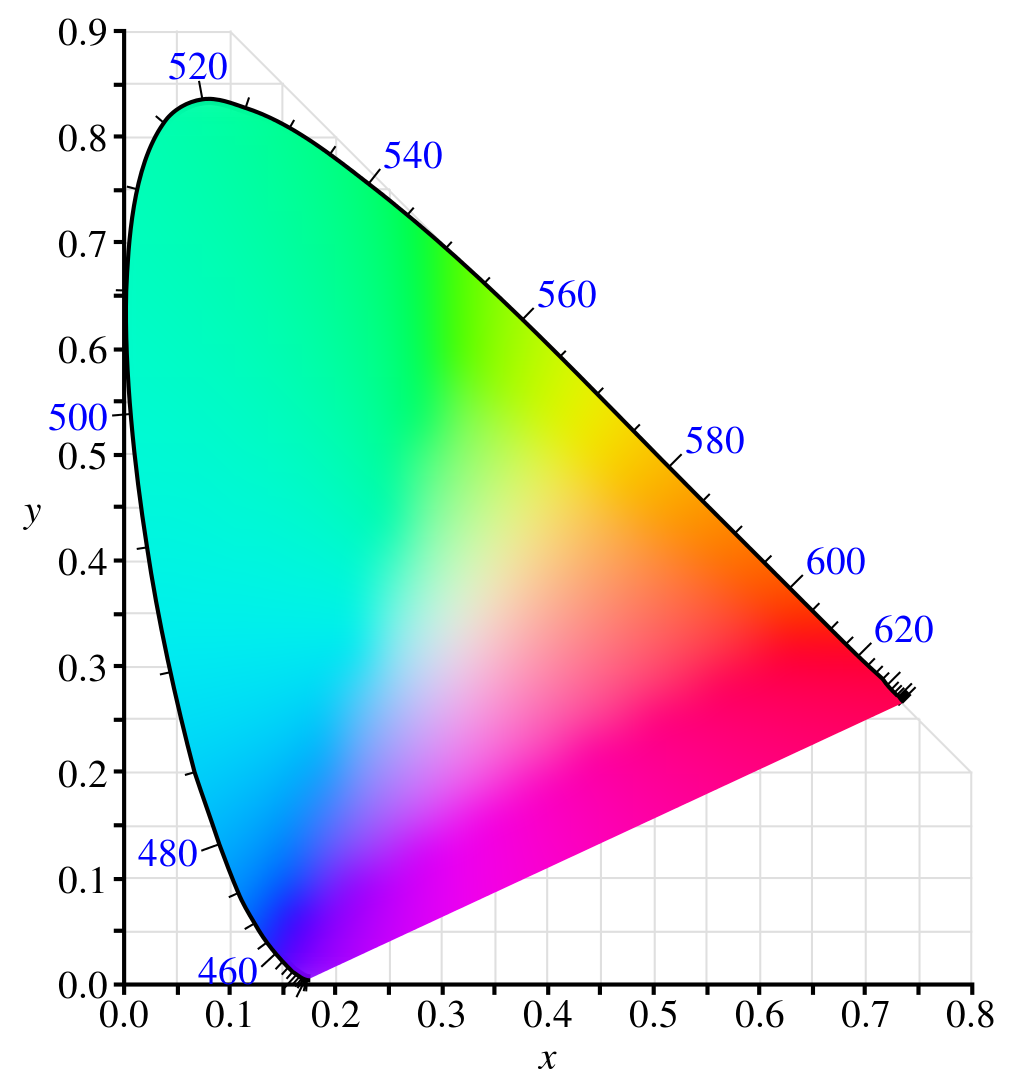
This comes in handy when we want to build color TV screens. A single LED can’t emit an arbitrary spectral power distribution, it can only emit a single wavelength of light. Since we only have three cones, we only need three basis wavelengths to build all colors from, which means only three LEDs are needed per pixel. However, the wavelengths you choose will determine the range of stimulus values you can create. For example, ultra-high-definition-television uses the ITU-R Recommendation BT.2020 standard, which uses LEDs with wavelengths 630 nm, 532 nm, and 467 nm. We see here the range of possible colors that can be created with any combination of these frequencies.
It is because we have three cone types that TVs use three LEDs per pixel, and also why we have three primary colors. The Bluebottle Butterfly has 15 cone types, which means it has 15 primary colors and sees colors from a 15-dimensional space (although I would suspect much less since the stimulus distributions likely overlap quite a bit). Our TV would look quite plain to the butterfly in exactly the same way that a black and white TV looks plain to us (although the dolphin couldn’t tell the difference either way).
An interesting lesson from this is that the primary colors we learn about in school have nothing to do with the laws of physics, but everything to do with our biology. This means when we go into the world to take scientific pictures, there is no reason to limit ourselves to 3 bands of light, why not more? That’s exactly what Hyperspectral Imaging is, and the most impressive hyperspectral camera I could find at the moment has 447 bands across the 400-1000 nm range.
The frequencies of light exist on a continuous spectrum (the frequency of light is only discreet when the photon is bound, such as in an energy well or when being emitted from an electron orbiting an atom). This means even our hyperspectral cameras are not enough. The world is displayed in infinite dimensional color space, of which our technology can forever approach, but never reach.